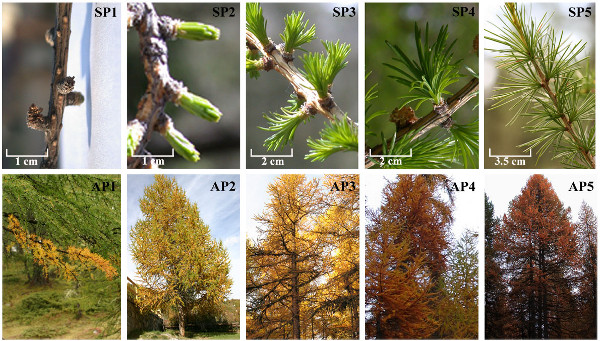
Phenological monitoring is usually carried out through field observations. Observations are made to detect the date of occurrence of the main phenological events like the ones shown in the picture below: budburst, leaf unfolding, autumn yellowing and leaf fall.
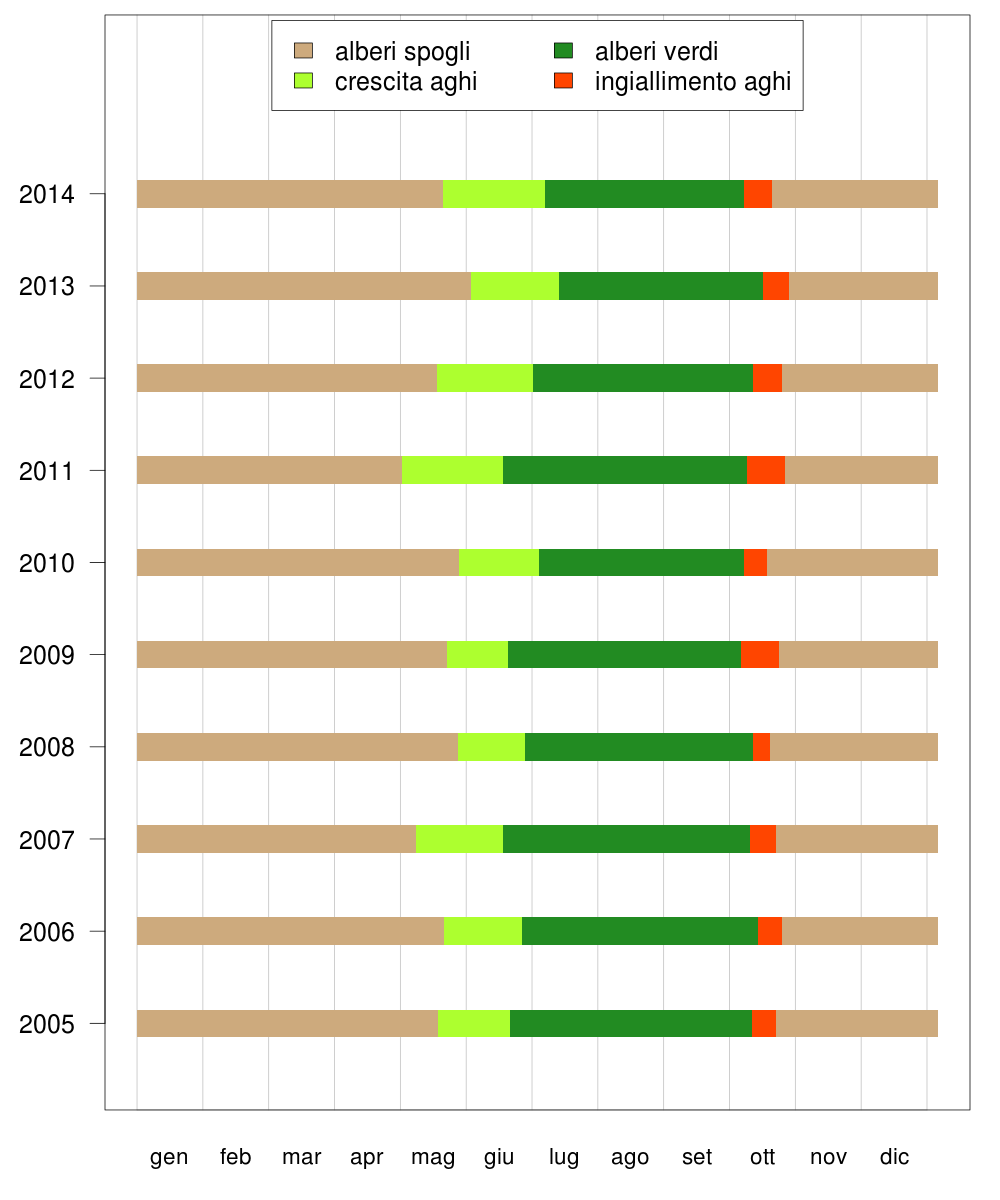
Following this approach, phenological observations are done at the Torgnon larch forest since 2005. Bar width in the plot below indicates the duration of the different phenophases. Brow bars indicate the period between the start of the year and the budburst as well as the period between leaf fall and the end of the year. Leaf unfolding is indicated in pale green. Budburst and the duration of leaf unfolding period are controlled by spring air temperature: warm years cause an anticipated development while cold years result in delayed spring. Darkgreen bars report the length of the period when canopy is fully developed while orange bars indicate the senescence phase i.e. days between yellowing and leaf fall. This phase is mainly controlled by August and September air temperature as well as by daylenght.
The graph below shows anomalies in the begin (BGS), end (EGS) and length (GSL) of the growing season observed in the last years. Considering BGS, a negative anomaly indicates an anticipated spring. Considering EGS and GSL, a positive anomaly indicates respectively a delayed senescence and a longer growing season. Anomalies are driven by climate conditions: red dots indicates the result of warm temperatures while blue dots indicates the impact of cold temperature.
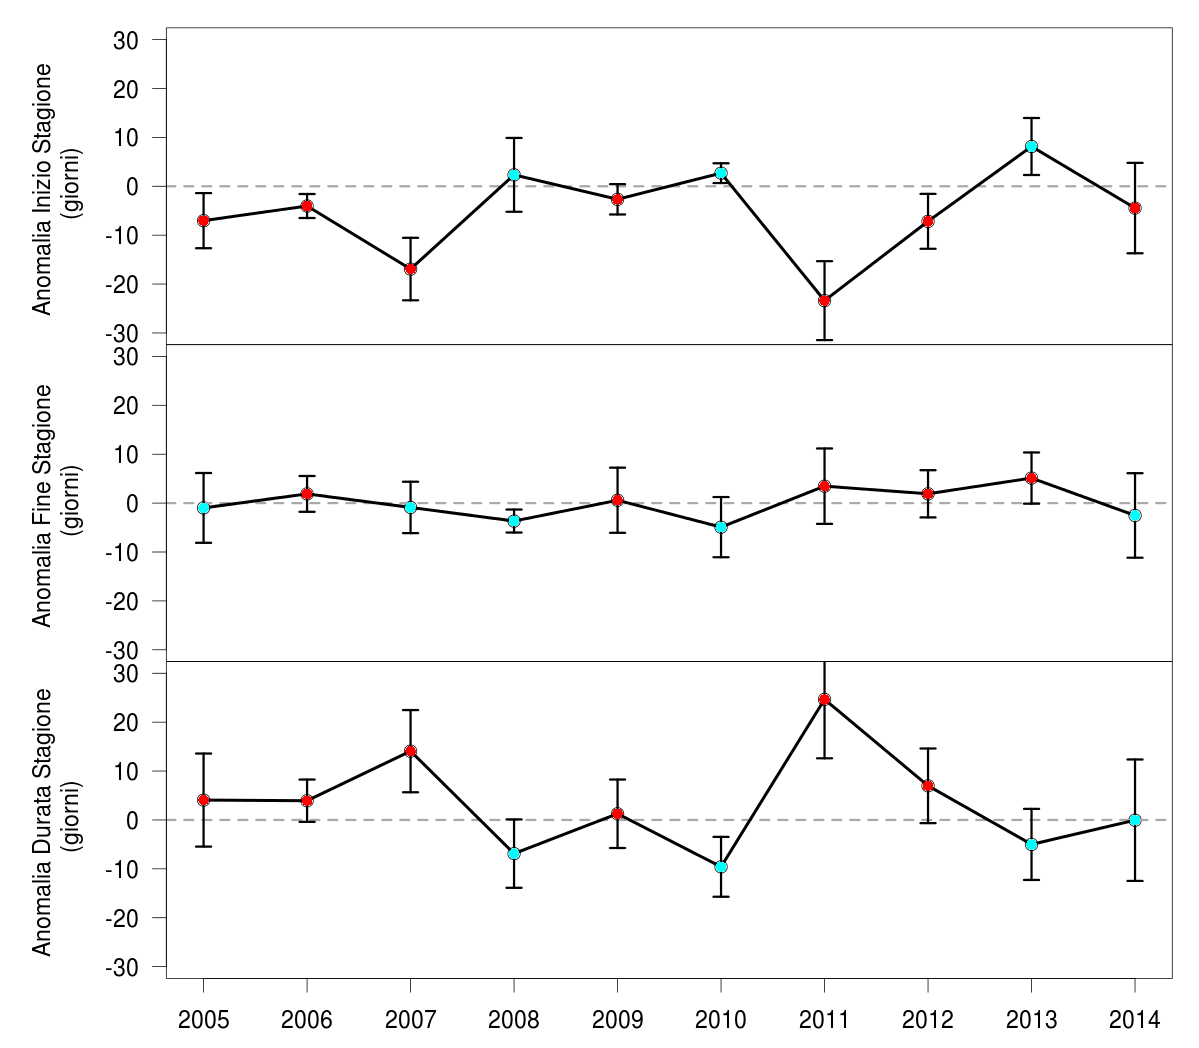 Spring is more sensitive to temperature changes than autumn and thus is more prone to climate change impacts. Anomalies are bigger and more frequent for BGS than for EGS. In the last 10 years spring development has been generally anticipated (7 years) with some extreme years like 2007 and 2011. In 2014, both BGS and EGS were anticipated as a result of warm Apr-May temperature and cold Aug-Sep temperature as show in the graph below.

This graph shows weekly air temperature anomalies in 2014.
Field observations provide reliable data but are very time consuming (expecially in the Alps) and can be influenced by observer bias. Moreover field observations are suited to observe phenology of species showing obvious phenophases. To overcome this main disadvantages, with are integrating field observations with digital cameras and NDVI sensors.
